Table Complete
Tables are the best thing in the world and using them you can create a very powerful tracking and reporting tool.
Last updated: Mon 10-Aug-2026 evening
Vision
You have a project to track to completion.
It can be broken into two dimensions of the project.
- Can be any dimensions - for example, widgets to make and the steps to make them.
- Each dimension can be broken into the effort for each widget, step, whatever.
You want to track how complete you are.
- How complete is each item in dimension one.
- How complete is each item in dimension two.
- How complete is the project overall.
Gathering Data
Before we build our table complete we will need to gather some data.
Dimensions
What are the two dimensions that we want to track?
Some examples are
- Widgets and Steps - let’s pick this one for the example
- Web Pages and Documents
- Watches and Steps to Purchase
- etc.
For each dimension you need to determine how many items there are.
- So, for the widgets this may be simple - we are going to build five widgets
- For the steps, it may be more complex.
- Some widgets have more steps than others.
- If so, see if you can consolidate and/or generalize the steps.
- If not, then just do the union of steps - say that four of the widgets have four steps but one has six steps.
- So, lets move forward to build five widgets with each taking six steps (knowing that for four of the five widgets one of the steps is n/a).
Size
Now we need to decide on the size of each widget and of each step. Think of size as a percentage as this is easier. It can work with other units but for now let’s assume percentage.
So, let’s look at dimension 01 Widgets.
The question to ask yourself is how big is each widget in a percentage basis.
You will have one of the following:
- You Know
- You know how big each item is compare to the others and can therefore easily assign the percentage size.
- You Know Relatively
- You can say that the first item is 10 points big.
- Then assign points to each of the remaining items.
- Then divide to get percentages.
- You Have to Guess
- You have no idea so you can guess.
- This is ok.
- You Cannot Guess
- It is so complex that you cannot guess.
- Fine - just make them all the same.
Recap where we are now
- We have the two dimensions.
- We have the number of items in each dimension - five widgets with six steps each.
- We have the size of each item in each dimension.
We can now construct the table (tables rule!!).
The Table
Construct the following table. Likely in excel but any way that you want to manage the table is fine.
Step 01: The Heatmap
| Widget 01 | Widget 02 | Widget 03 | Widget 04 | Widget 05 | Totals | |||
|---|---|---|---|---|---|---|---|---|
| 20% | 20% | 20% | 20% | 20% | ||||
| 01 | Step 01 | 10% | ||||||
| 02 | Step 02 | 20% | ||||||
| 03 | Step 03 | 15% | ||||||
| 04 | Step 04 | 30% | ||||||
| 05 | Step 05 | 10% | ||||||
| 06 | Step 06 | 25% | ||||||
| Totals |
So, let’s look at the above table and appreciate what it shows us
- A column for each widget that we have to build.
- A row for each step that we will have to take to build each widget.
- We know that for four widgets they will not have one of the steps - so we can put in “n/a” into those cells.
- Each widget and each step has a percentage of the overall size associated with it.
- We now have a plan. See Status Reports for more details on plans and how to use them.
We can then fill into each cell “DONE” when we have completed that step for that widget.
And we now have the first level heatmap of your plan and status against the plan.
Step 02: A Better Heatmap
We can improve the heatmap a little by filling in the cells with something more than just DONE.
Fill in the percentage done in each cell.
If you cannot determine what the percentage done really is you can use the following:
- 0%: Has not started
- 10%: Started
- 50% Half way done
- 90%: Mostly done
- 100%: Done
Note that if you can have the actual percentage done this is better. But if not, then the above rough percentages are good enough.
If you are using Excel (or similar) you can then conditionally code the table cells based on the percentage done giving you a more visual heatmap.
Step 03: Column and Row Totals
You can now add a row at the bottom and a column to the right side with the following.
- I’d recommend doing this now in Excel (or equivalent) to follow along with the rest of this page.
Bottom Row
- Each cell in the bottom row should be the dot product (SUMPRODUCT in Excel) of the following columns
- The percentages column for each row (10%, 20%, 15%, 30%, 10%, 25% in the example above).
- The column in that cell - so Widget 01, Widget 02, etc.
- This bottom row then has total percentage done for each column.
- So you now know the percentage done for each Widget.
Right Column
- Similar to above, each cell of the right column will contain the dot product (SUMPRODUCT in Excel) of the following rows
- The percentages row for each column (20%, 20%, 20%, 20%, 20%, 20% in the example above).
- The row in that cell - so Step 01, Step 02, etc.
- This right column then has total percentage done for each row.
- So you now know the percentage done for each Step.
So you can now answer the following questions
- How much percentage done is each Widget?
- How much percentage done is each Step?
You can add two more dot products (SUMPRODUCT in Excel) that will calculate the same thing.
- First Option
- The percentages column for each row (10%, 20%, 15%, 30%, 10%, 25% in the example above).
- The new right column.
- Second Option
- The percentages row for each column (20%, 20%, 20%, 20%, 20%, 20% in the example above).
- The new bottom row.
Step 04: Burn Up
So let’s say that you have the table with the bottom row and right column but have not as yet started the work.
The first question you should ask yourself is what is the plan to complete this work?
- How many weeks (or the appropriate time frame) will it take to complete?
- What percentage done will be accomplished each week?
Let’s assume that you decide:
- 10 weeks
- 10% each week
This means that you can create a plan for the work to be done.
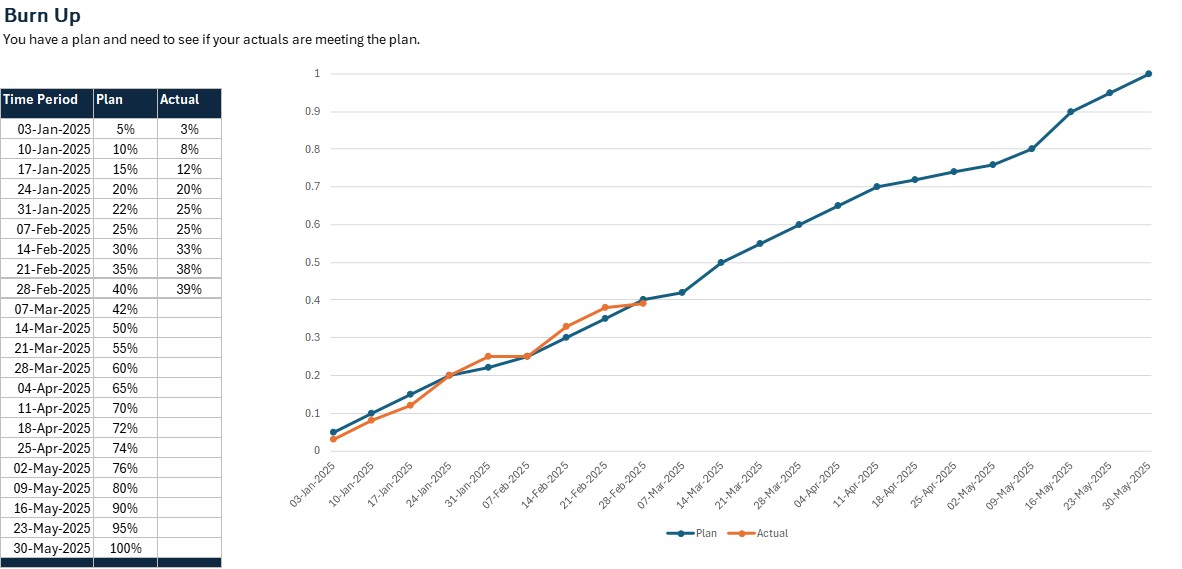
- That plan is a simple burn up chart.
- Week 00 - 0% done
- Week 01 - 10% done
- Week 02 - 20% done
- etc.
Each week you fill in the cells and see what the total is and add this to your burn up chart to show the actuals.
- You now have a Burn Up chart with the plan and the actual.
- You can see of you are ahead, on-track or behind schedule just by looking at the two curves in the Burn Up chart.
- You can then create a status reports to report on the status of your project.
Here is a sample Burn Up chart (TBD: Update the chart to more closely reflect the example above).
Key Takeaways
The tracking is simple: For Widget XX, how much of Step YY is done.
- A simple question.
- Ease to assertain.
- Easy to fill in.
- Easy to track.
The clarity to those working on the project is high.
- It is very easy to see what work we are doing and tracking.
Size growth is trackable.
- If last week we thought that a cell was 90% done.
- But this week we realize that it is only 40% done.
- Just change the 90% to 40%.
- All the other numbers will update.
- You will get the new status.
Progress against the plan is easy to see in the Burn Up chart.
Appendix
Version History
| Date | Notes | |
|---|---|---|
| 01 | Mon 10-Aug-2026 | Initial version |