Burn Down Charts
Building upon Earned Value Analysis, a Burn Down Chart captures an amazing amount of information as to the progress of the project.
- Burn Down Charts
- Executive Summary
- Prerequisite
- Vision
- Data
- Independent Data
- Dependent (or Derived) Data
- Planned Burndown
- Planned Value (size)
- Planned Value (%)
- Velocity - Actual Completed (AC)
- Velocity - Average
- Total Points Projected - Estimate at Completion (EAC)
- Size (Points) Remaining
- Velocity Projected
- Estimate To Completion (ETC)
- Earned Value (%)
- Earned Value (EV) (points)
- Schedule Performance Index (SPI)
- Summary
- Chart
- Appendix
Last updated: Wed 19-Aug-2026 afternoon
Executive Summary
Building upon Earned Value Analysis the modern Burn Down Chart is a wealth of information to allow you to track a project with minimal input data.
Burn Down Charts will show you
- The plan
- The actuals
- How the actuals compare to the plan
- Predict the future
This page tells you how to accomplish the above and more.
Prerequisite
This page build upon Earned Value Analysis, and I would recommend that you have a read of that first so that you have a basic understanding of what Earned Value Analysis is.
Vision
A burndown chart is a visual representation of some data that helps you track a project.
Here a project means
- A set of tasks to accomplish a goal.
- Typically performed by a group of people.
- Typically over a few periods.
There is a desire to
- Understand the plan.
- Track work done and remaining.
- Predict the future.
To understand how a burndown chart works and why it is beneficial, let’s walk through an example.
Data
Recall that we start with the data.
In particular we have two types of data:
- Independent
- Dependent (also can be thought of as derived)
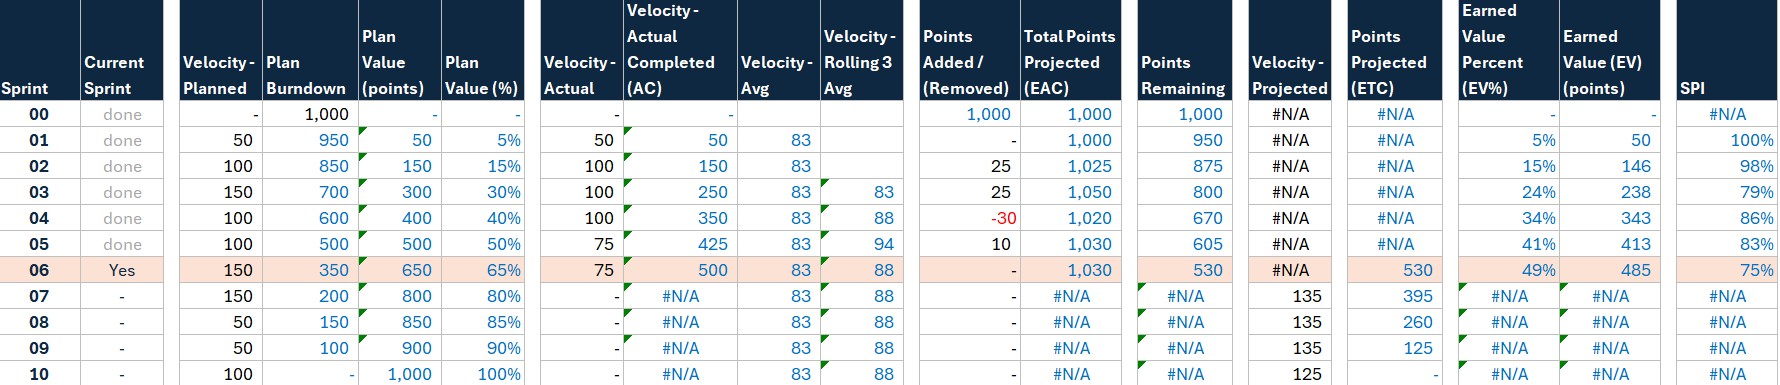
Here is a screen grab that may help you visualize what we are discussing in the below.
Independent Data
Let’s start with the project and what project stakeholders will need to know about it.
Size
- The project has a planned size.
- This is also known as the Budget at Completion
- It can be the number of days to accomplish all work, across all members of the group working on the project.
- It could be the number of widgets that need to be build.
- It could be the number of points that need to be build.
Periods
- The project will be delivered in a number of periods.
- These could be weeks / months / etc.
- These could be sprints.
Velocity - Planned
- Now that the project has the total size (e.g. points) and the total number of periods (e.g. sprints) we need to determine how much work we will accomplish in each period (e.g. sprints).
- So in our example, how many points will we do in each sprint.
- This could be evenly distributed.
- So if have 1,000 points to deliver over 10 sprints; we could say that the velocity is 100 points per sprint.
- More likely it will not be evenly distributed for a number of reasons.
- Staff: People will be taking vacations over the duration of your project.
- Holidays: Certain larger holidays could lower your ability to do work in some sprints.
- Ramp Up: Your staff will e ramping up and may not be the most efficient at the start of the project.
- etc.
Velocity - Actual
- As the project is being executed, the project you will have the actual velocity (e.g. the number of points accomplished each sprint) which will likely not be the same as the planned velocity.
Size Added or Removed
- As the project is being executed, it will become clear that some of your original estimations of work were not correct.
- Work that was forgotten, needs to be added.
- Work that was assumed to be needed, is no longer is needed.
- So the project will add or remove work (e.g. points) through out the execution of the project.
Velocity - Projected
- As the project is being executed, it will need to adjust the projected velocity for the remaining periods (e.g. sprints). This will occur for a number of reasons:
- Not as much work as initially thought would be done, was in fact done.
- More work than expected was done.
- Staffing levels changed.
- etc.
- This will result in future periods (e.g. sprints) having a different velocity than the initially planned velocity.
Note that in the above the following are one time things
- Size
- Periods
- Velocity - Planned
And these occur once at the end of each period (e.g. sprints)
- Velocity - Actual
- Size Added or Removed
- Velocity - Projected
That’s it. Just three independent variables for each period (e.g. sprints).
Dependent (or Derived) Data
Now that we have our independent data there are a number of dependent (or derived) data that we can calculate.
Planned Burndown
- Given the number of periods (e.g. sprints) and the velocity for each period we can easily calculate the planned burndown.
- Starting with the total size (e.g. points) just before we start (i.e. the Budget at Completion)
- Then reducing by the planned velocity each period (e.g. sprints).
- The Planned Burndown across the project emerges.
- This shows the amount of remaining work at the end of each period (e.g. sprint).
Planned Value (size)
- The inverse of the Planned Burndown is the Planned Value.
- That is, how much work that was intended to have accomplished at the end of each period.
- It is simply the cumulative sum of the planned velocity as each period (e.g. sprint) is completed.
Planned Value (%)
- At the end of each period (e.g. sprint) this is
- Planned Value (e.g. points) / Size (e.g. Budget at Completion)
- That is, what percentage of the project do you intend to have completed by the end of each period (e.g. sprint)?
Velocity - Actual Completed (AC)
- This is how much work (e.g. points) has actually been completed at the end of each period (e.g. sprint).
- It is simply the cumulative sum of the actual velocity as each period (e.g. sprint) is completed.
- You will note that, in the general case, the Velocity - Actual Completed (AC) will not be the same as the Velocity - Projected.
- Rarely do our realities exactly match our plans; and that is ok.
Velocity - Average
- We can calculate the average velocity across your periods (e.g. sprint).
- There are many ways to calculate this but two popular mechanisms are:
- Average
- This is the average across all periods (e.g. sprints).
- Rolling X Average
- This is the average across the last X periods (e.g. sprints).
- This is often a more indicative number of future performance as it eliminates the older velocities where the team was not working as they are now.
- Often X is three as this is a good number but pick your own number as you desire.
- Average
Total Points Projected - Estimate at Completion (EAC)
- Over the period (e.g. sprints) the project may have added or removed points.
- This gives you a running total of the expected size (e.g. points) at the end of the project at any given time.
- Initial Size + Size Added - Size Removed
- or
- Initial Points + Points Added - Points Removed
Size (Points) Remaining
- At the end of each period (e.g. sprint) you will have
- Total Points / Estimate at Completion (EAC)
- Velocity - Actual Completed (AC)
- Simple math will give you the Points Remaining as
- Total Points Projected - Estimate at Completion (EAC) - Velocity - Actual Completed (AC)
- That is, given the current estimate of how large the project is; and the size (e.g. points) of the work already completed. Then how much work (e.g. points) is remaining?
Velocity Projected
- At the end of each period (e.g. sprint) you will have
- Points Remaining
- Remaining number of periods (e.g. sprints)
- This will in all likelihood not match the plan so we will have to create a projected future.
- We need to fit in the remaining work (e.g. points) into the remaining periods (e.g. sprints).
Estimate To Completion (ETC)
- Given that we have a new projected velocity we will have a new estimate of the size (e.g. points) of work needed to complete the project for each of the upcoming periods.
- This is simply the remaining work (e.g. points) each period (e.g. sprint) after the projected velocity has been accomplished.
Earned Value (%)
- Recall that we started with the Planned Value (%) which was the percentage of the plan that we expected to have completed each period (e.g. sprint).
- Given that we did exactly meet the plan in each period (e.g. sprint) we need to calculate the Earned Value (%) as
- Velocity - Actual Completed (AC) / Total Points Projected - Estimate at Completion (EAC)
- This is the percentage of the original plan that was actually earned.
Earned Value (EV) (points)
- Similar to the Earned Value (%) this measurement tells us how much of the original size (e.g. points) of the project have we earned.
- Earned Value (%) * Budget at Completion
- This is the number of original size (e.g. points) that that was actually earned.
Schedule Performance Index (SPI)
- This is measure as to whether we are on track against plan or not.
- Planned Value (%) / Earned Value (%)
- That is how does our earned value compare to the planned value.
- This is very simple to interpret
- Greater than 100%: Ahead of schedule.
- 100%: On schedule
- Less than 100%: Behind schedule.
- The tracking of the entire project can be brought down to this one number.
- Equal to or greater than 100%: Nothing to worry about.
- Less than 100%: Ask some questions and understand where the project is.
Summary
| Planning Measurements | Tracking Measurements | Ending Measurements |
|---|---|---|
| Size / Budget at Completion | Total Points Projected | Estimate at Compltion (EAC) |
| Periods | ||
| Velocity - Planned | Velocity - Actual | |
| Velocity - Average | ||
| Velocity - Projected | ||
| Estimate to Complete (ETC) | ||
| Planned Burndown | ||
| Planned Value (size) | Velocity - Actual Completed (AC) | |
| Planned Value (%) | ||
| Size (Points) Remaining | ||
| Earned Value (%) EV% | ||
| Earned Value (size) EV | ||
| Schedule Performanec Index (SPI) |
Chart
All that data can be presented in a tabular format and tables are the best thing that has ever been invented.
But we can also understand that data in a chart.
If we look at this chart as an example we can see the following. Yes, I know it is complex and you can reduce the complexity if/as needed but lets walk through it one step at a time and how you can read the chart efficiently.
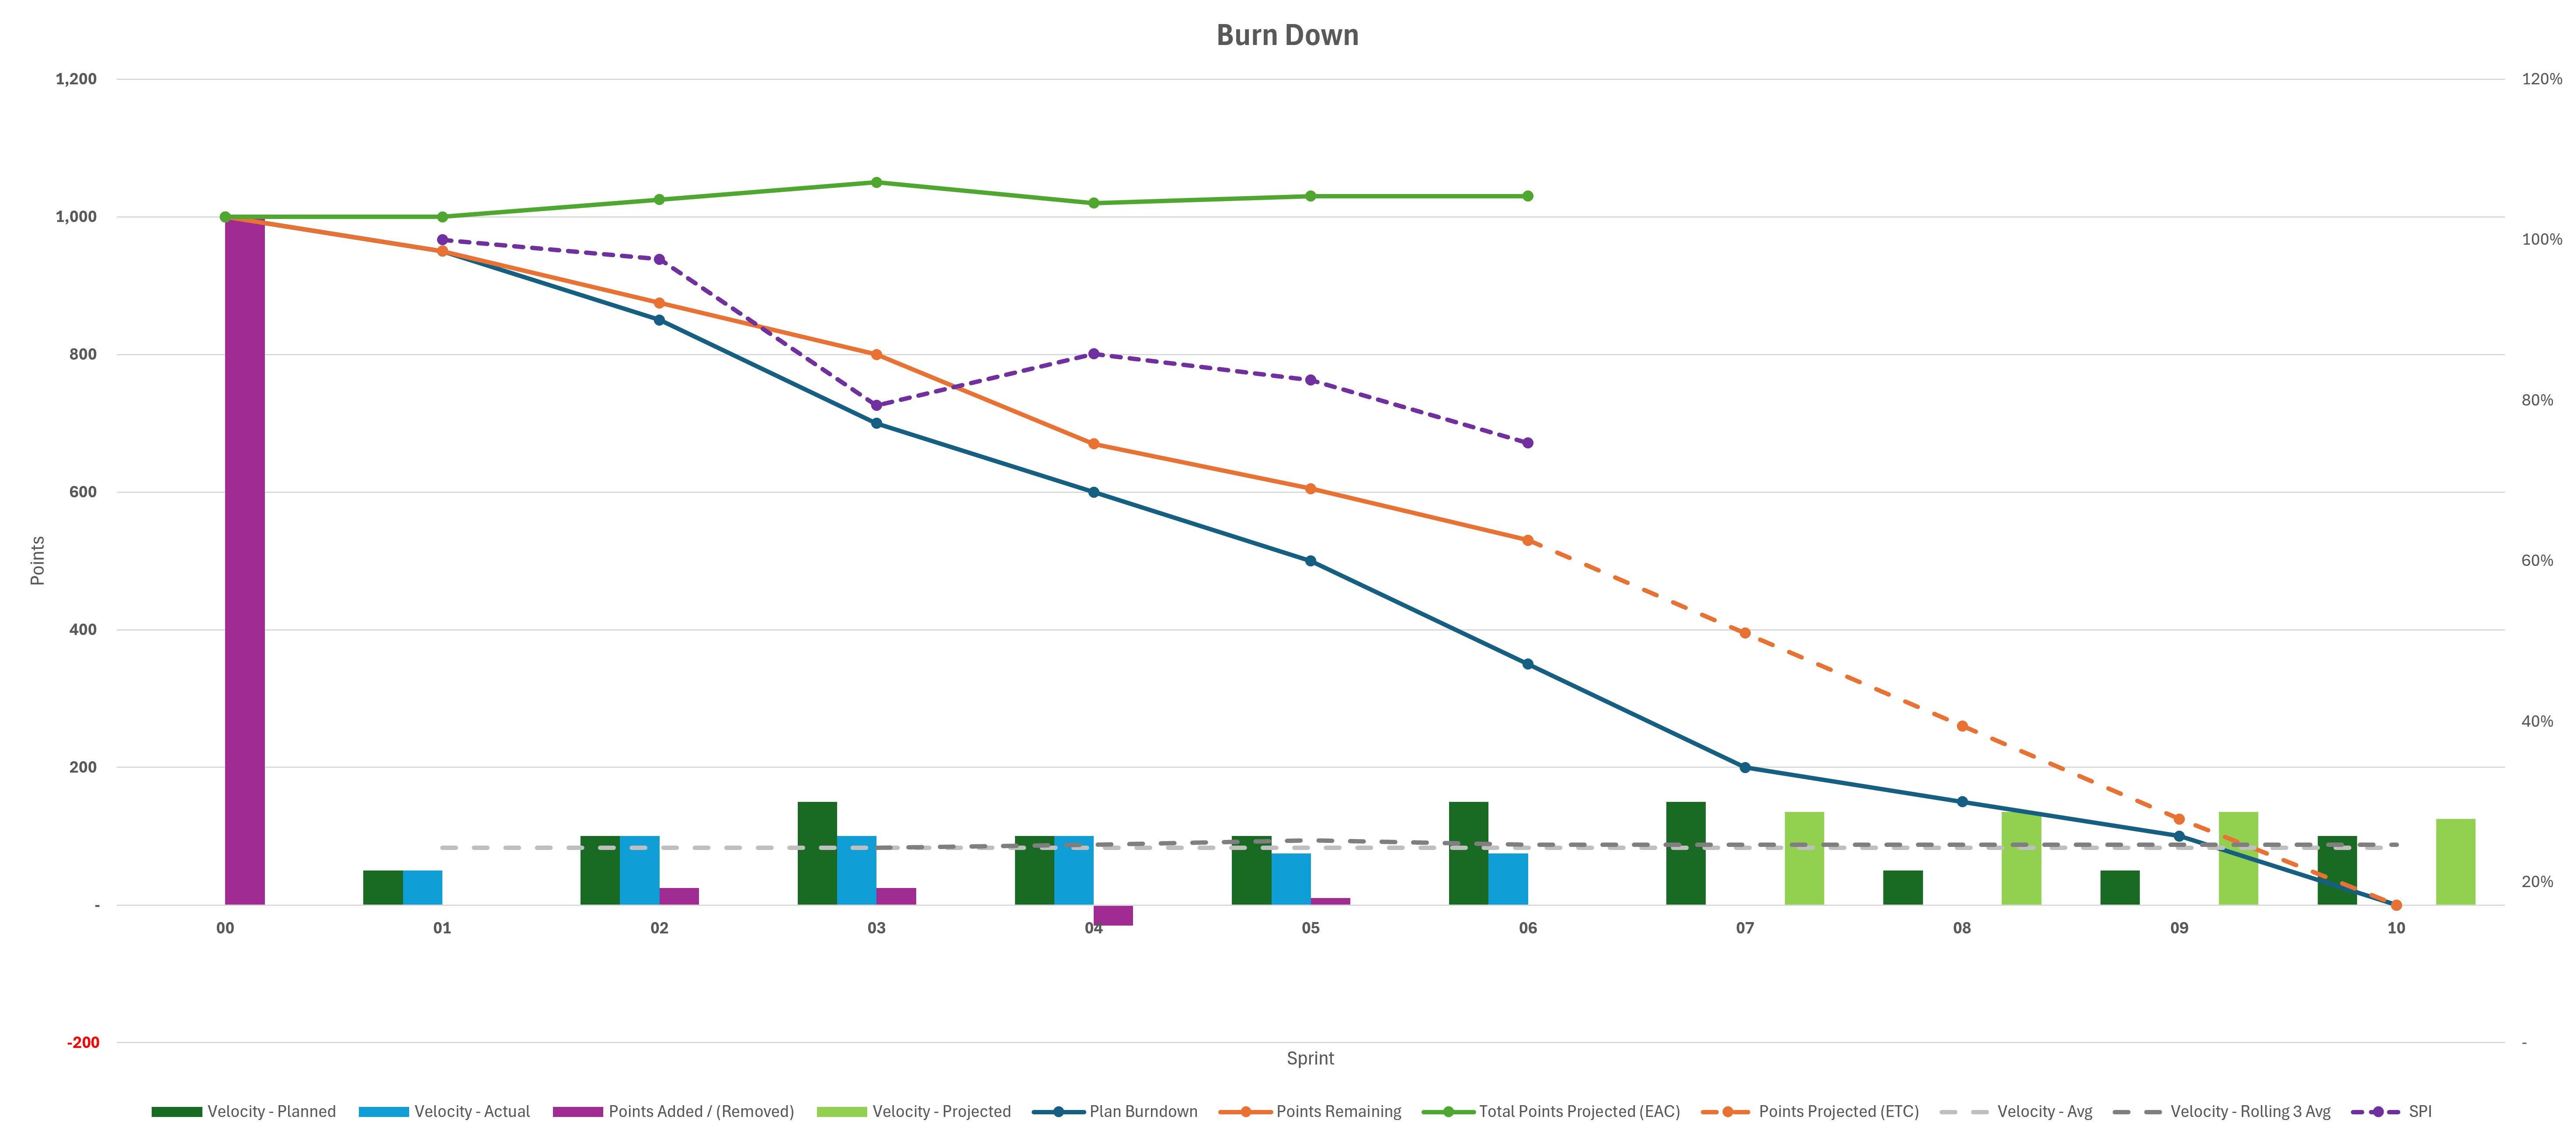
Velocity - Planned
- How much work (e.g. points) is planned to be accomplished each period (e.g. sprint).
Velocity - Actual
- How much work (e.g. points) is actually being accomplished each period (e.g. sprint).
Points Added / (Removed)
- How much size (e.g. points) is the project adding each period.
Velocity - Projected
- What does the newly projected velocity look like?
Plan Burndown
- This is your planned burndown.
- It will start at the full size (e.g. points) and then reduce each period (e.g. sprint) by the planned velocity for that sprint.
- It if your plan at a glance.
Points Remaining
- This is the actual points remaining each period (e.g. sprint).
- This is what the project is actually achieving.
- If the lines overlap
- Congratulations you have been achieving the plan perfectly.
- If the Velocity - Actual line is lower than the Velocity - Planned line
- Congratulations the project is ahead of the plan.
- If the Velocity - Actual line is higher than the Velocity - Planned line
- Some attention is needed as the project is behind plan.
- If the lines overlap
Total Points Projected (EAC)
- This is the projected size (e.g. points) of your project at the end.
- If flat
- Total project size is under control and not deviating from the plan.
- If reducing
- Total project size (e.g. points) is getting smaller.
- Determine why and if the reason is a good thing or not.
- But from a project delivery perspective this is a good thing as there is less to deliver than was planned so the chances of being late are reduced.
- If increasing
- Total project size (e.g. points) is getting larger.
- Determine why and if the reason is a good thing or not.
- But from a project delivery perspective this is cause for worry as the project has more to deliver than was originally planned.
Points Projected (ETC)
- This is the burndown of the remaining velocity.
- What does the project have to achieve and is it more than or less than the plan.
Averages
- You can plot a number of velocity averages. Pick one that makes sense to the project.
- But the real value here is how the other measures cross the average line.
- The average is the historic amount of work that the team can deliver per period (e.g. sprint).
- Compare the other data on the chart to the average line to see how what the project is planning compares to the historic average.
- Under the average
- Great, good chance of achieving this.
- Over the average
- Worrisome as the team has not achieved this productivity before.
- Under the average
Appendix
Attachments
| Attachment | Description |
|---|---|
| Burndown Chart - Data | Sample burndown data. |
| Burndown Chart - Chart | Sample burndown chart. |
| Burndown Chart Sample | Sample excel file. |
Version History
| Date | Notes | |
|---|---|---|
| 01 | Wed 19-Aug-2026 | Initial version |